

Improving Working Capital Through Inventory Management
Measure the cash in your stock by SKU class, cut against supplier-confirmed dates instead of turnover averages, and turn slow stock back into cash without triggering expedites.
Improving working capital through inventory management comes down to deciding which stock to cut based on your own PO pipeline, not a generic turnover target. Score every candidate against supplier-confirmed dates, past-due orders and real customer need dates. Then you release trapped cash without triggering stockouts, or expedites on orders you already committed to.
What is the relationship between inventory and working capital?
Inventory is cash you have already committed, sitting on shelves and in WIP. Every PO you receive becomes a bill you pay on the supplier's terms, and the cash comes back only when a customer pays for what you built with it. Until then, it sits in raw materials, finished goods and the safety stock you bought just in case.
Working capital is current assets minus current liabilities. For a small manufacturer, inventory is usually the largest piece of it you can control. Customer payment terms are hard to shorten and payroll is fixed, but you decide how many days of stock you carry against real demand.
The cash conversion cycle shows where those days sit: days inventory outstanding (DIO) plus days sales outstanding, minus days payables outstanding. Every day of DIO you cut is a day less of cash you have paid out and not yet collected. Cut it by tying stock decisions to confirmed inbound dates and customer need dates, and the cash shows up in the bank, as on our cash results page.
How do you calculate how much cash is tied up in inventory?
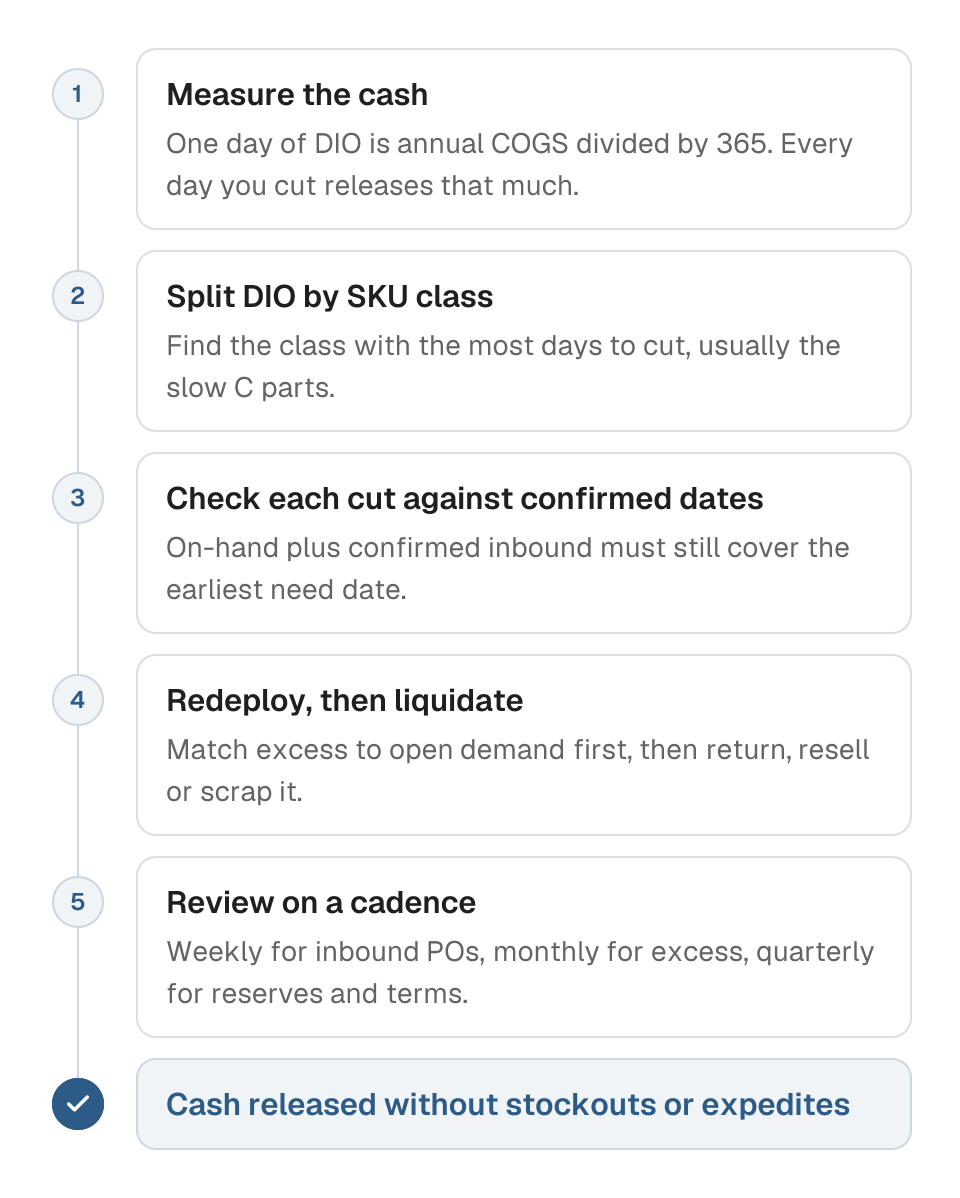
The cash tied up in inventory is the inventory's value at cost. To see what each day of stock is worth, divide annual cost of goods sold (COGS) by 365. DIO is average inventory ÷ annual COGS × 365, so every day you cut from DIO releases one day of COGS.
Pull two numbers from your ERP: annual COGS, and average inventory at cost (opening plus closing balance, divided by two). Take a manufacturer with an average inventory of $2.4M and annual COGS of $9.6M. DIO is 2.4 ÷ 9.6 × 365 = 91 days, and one day of COGS is about $26,300. Cutting 10 days of DIO releases about $263,000 in working capital. That is the number to bring to your CFO.
One blended DIO hides where the cash sits. Split it by SKU class and it usually piles up in one place:
| SKU class | Inventory at cost | Annual COGS | DIO | Cash per day of DIO |
|---|---|---|---|---|
| A, fast movers | $900K | $6.57M | 50 days | $18,000 |
| B, steady | $600K | $2.19M | 100 days | $6,000 |
| C, slow or obsolete | $900K | $0.84M | 391 days | $2,300 |
| Total | $2.4M | $9.6M | 91 days | $26,300 |
Class C holds 37.5% of the cash and drives under 9% of COGS. A day cut from C releases the least cash, but C has the most days to cut. Bringing C down to 180 days releases about $486,000 without touching the A parts that keep shipments moving. Cutting A by 10 days would release $180,000, right where a stockout stops a customer order.
Two cautions before you cut C. Some slow parts are long-lead spares or last-time buys you hold on purpose, so check each one. And an open PO on a C part adds cash to the slowest pile, so check the inbound commitments before the stock itself. PO confirmation gives you a confirmed date on each of those lines.
Which inventory KPIs predict working capital strain?
DIO and inventory turns lag. They describe last quarter, after the cash is already stuck. The signals that move first live in your PO pipeline and SKU file, weeks before DIO does.
Four measures, reviewed weekly, cover most of it:
- Past-due inbound PO lines, by supplier. Each one is a date that already failed once. Buyers react by ordering early or ordering more, and that stock lands later on top of the late order.
- Confirmed-date slippage on open POs. The gap between the supplier's confirmed date and your need date, and whether it is growing.
- Weeks of supply against need dates. Per SKU, measured against actual demand dates, not average use.
- Stock with no demand in the next six months. The share of inventory value no order or forecast will consume. This is tomorrow's obsolete stock, and every month it sits it costs you carrying cost. Many finance teams plan on 20 to 30% of inventory value a year; build your own from your cost of capital, storage, insurance, shrink and obsolescence.
That set fits in a spreadsheet. Reconciling ERP records against supplier replies is where teams drown. Past-due purchase orders and promise date vs need date cover the first two in depth. Cartograph keeps those dates current from supplier replies. It will not fix a supplier master full of stale lead times, so clean that data first.
How should inbound purchase orders factor into inventory reduction decisions?
A SKU can look overstocked until you check whether the POs covering it will arrive. Cutting stock against on-hand quantity alone is how you end up paying for premium freight two weeks later. Every reduction decision needs three numbers side by side: what you have, what customers need and when, and what suppliers have confirmed and when.
The need date is when production or a customer order consumes the material. The confirmed date is what the supplier committed to in their order confirmation, not the date you asked for. On-hand is what sits in the warehouse today. If on-hand plus confirmed inbound covers the need dates through the next cycle, you can cut. If confirmed dates are missing or later than the need dates, the extra stock is not excess. It is your buffer against a late order.
Before you cancel or defer any PO, check four things:
- Every open PO line for the SKU has a supplier-confirmed date, not just a requested one.
- On-hand plus confirmed inbound still covers your earliest need dates after the cut.
- None of the POs you are counting on is already past due.
- You know what a late shipment would cost on the customer orders this SKU feeds: a penalty, a line stopped at the customer, or a lost reorder.
Most teams skip these checks because chasing confirmations across email and phone turns them into a half-day job. The advice to verify before cutting assumes someone whose whole job is staying on top of it. Cartograph's overdue shipment tracking runs the confirmation and past-due checks so the review takes minutes. You still own the call on which customers matter most.
A past-due PO tells you the supplier's real lead time is longer than your system thinks. If a SKU has a history of late deliveries, hold the stock and fix the inbound date data before cutting anything. Cutting against a date nobody believes is how stockouts start.
When does reducing inventory hurt on-time delivery and cash flow?
Cutting stock against confirmed inbound dates works. Cutting against a spreadsheet average fails three ways: stockouts that stop production, premium freight to recover, and expedite costs that can exceed the carrying cost you saved.
Run the math per SKU before you cut. Say you cut $2,000 of stock on a part, and carrying cost runs 25% a year. You save $500 a year. One expedite that adds $500 in freight and overtime wipes out the whole year's saving. That is why the confirmed dates on open and past-due POs matter more than the reorder point: they tell you which cuts are safe and which are gambles. Expediting covers what to do when a cut has already gone wrong.
A stockout delays cash too. A shipment that leaves two weeks late is paid two weeks late, whatever the customer's terms. If cutting $20,000 of stock makes a $100,000 shipment late, you have held back five times the cash you freed. Tie every reduction to a real customer need date, not a safety stock formula alone.
How do slow-moving and obsolete inventory get converted to cash?
Redeploy first. Before selling anything, check whether the excess can cover open customer orders or production orders already planned. Put each SKU's excess quantity next to its open sales order dates and confirmed PO need dates. If a production order is due in six weeks and the parts sit in the wrong warehouse, a transfer beats a discount. This step costs a few hours of reconciling records and no cash.
Then liquidate, in order of how much cash each channel returns per dollar:
- Return to the supplier. Usually the best recovery, if the supplier takes returns and the restocking fee is tolerable.
- Sell to another manufacturer. Works well for raw materials and standard parts that a non-competing company uses.
- Excess inventory brokers. They pay less but move volume fast and clear the space.
- Scrap or write-off. The least cash back, but it frees warehouse space and stops the carrying cost on dead stock.
A write-off is an accounting entry, not a physical one: the stock sits there until you dispose of it. Accounting standards carry inventory at the lower of cost and net realizable value, so obsolete stock gets written down when its value falls. Tax works differently, and rules vary by country. In the US, stock that still sells at normal prices can't be written down just because it moves slowly; the deduction generally comes when you sell, scrap or donate it. Goods that no longer sell at normal prices, because of damage, obsolescence or odd lots, can be valued at the price you actually offer them at within 30 days of the inventory date, less the cost of disposal. Keep records of each disposition, and have your CPA or tax advisor confirm the treatment before you scrap anything.
Bring your CFO the SKU list, its aging and the proposed disposition on one sheet, and the conversation takes an hour instead of a quarter.
What cadence should a working capital inventory review run on?
Three tiers work for a two-person materials team: weekly for inbound commitments, monthly for excess, quarterly for reserves and terms. Each tier answers one question and takes under an hour once the list is built.
- Weekly: PO pipeline against on-hand. Compare confirmed supplier dates with on-hand stock and open demand. Flag POs whose confirmed dates slipped past need dates, since those drive both the stockouts and the expedites that follow.
- Monthly: the excess and slow-mover list. Rank SKUs by months of supply against demand. Anything over your coverage threshold gets a decision: use it, transfer it, return it or sell it.
- Quarterly: the obsolescence reserve and supplier terms. Write down obsolete stock so the balance sheet tells the truth. Review payment terms with your largest suppliers too, since longer payables shorten the cash conversion cycle as surely as lower DIO.
Which tools help without adding a second job?
Your ERP holds the raw material for every decision in this guide: need dates, confirmed dates, past-due orders and on-hand balances by SKU. What it doesn't do is chase suppliers for confirmations, flag readiness signals or reconcile what suppliers say by email with what the ERP shows. That chasing is the second full-time job you are trying to avoid.
Spreadsheets work until the PO pipeline changes daily. A workbook built on Monday is stale by Wednesday, because need dates moved, an expedite landed or a customer pushed an order. The upkeep grows with every SKU and supplier you add, and the logic lives in one person's head.
Advanced planning suites are built for teams with dedicated planners. Cartograph ties SKU-level inventory decisions to your actual PO pipeline. It is free for unlimited team members, and Scout Agent is priced per successful outcome. Cartograph does not replace your ERP's transactions, and if the PO data in your ERP is wrong, Cartograph starts from the same wrong data. No tool fixes dirty master data.
Questions teams ask
How does inventory management affect working capital?
Inventory is cash you have paid out or owe suppliers that comes back only when customers pay. For a small manufacturer it is usually the largest part of working capital you control, and every day you cut from DIO releases one day of COGS. In the worked example, cutting 10 days frees about $263,000.
How much working capital should be tied up in inventory?
There is no universal target; it depends on supplier lead times, demand variability and customer terms. Start from your own position: inventory at cost and DIO, split by SKU class. In the worked example, slow C parts hold 37.5% of the cash while driving under 9% of COGS, which makes them the first place to look. Check each one for long-lead spares before you cut.
Is reducing inventory always good for cash flow?
No. Cutting against a spreadsheet average instead of confirmed PO dates causes stockouts, premium freight and expedites, and one expedite can cost more than a year of carrying cost on the stock you cut. A late shipment also delays the customer's payment by as many days as it is late.
How do you free up cash from excess inventory in manufacturing?
Redeploy first: match excess stock to open customer orders or planned production orders, since a transfer costs no cash. Then return it to the supplier, sell it to another manufacturer or to a broker, in that order of recovery. Scrapping returns the least but stops the carrying cost. Confirm the tax treatment with your advisor before you scrap anything.
What is a good inventory turnover ratio for working capital?
A single blended target misleads, because it hides where the cash sits. Turnover also lags: it describes last quarter, after the cash is already stuck. Track the signals that move first instead: past-due inbound POs, confirmed-date slippage, weeks of supply against real need dates, and stock with no demand on the horizon.